

Freshers are usually asked about SQL, Excel, a BI tool such as Power BI, basic statistics, one project they have worked on, and a few behavioral questions. The best way to prepare is to practise short, clear answers and be able to explain one or two real projects from start to finish. This guide gives about 40 data analyst interview questions and answers at fresher level, plus a 7 day preparation plan.
If you are searching for data analyst interview questions and answers, this page is built to be practised from, not just read. Every question has a short answer you can say out loud in under 30 seconds. The questions are grouped by topic so you can jump to your weak area, whether that is SQL, Excel, Power BI, Python, statistics or the HR round.
These data analyst interview questions for freshers with answers are written in plain language. Use them as a base, then put the answer in your own words, because interviewers can tell when an answer is memorized.
Data Analyst Interview Process for Freshers
The data analyst interview process changes from company to company, so treat the steps below as common patterns, not a fixed rule. A small company may do everything in one conversation, while a larger one may split it into several stages.
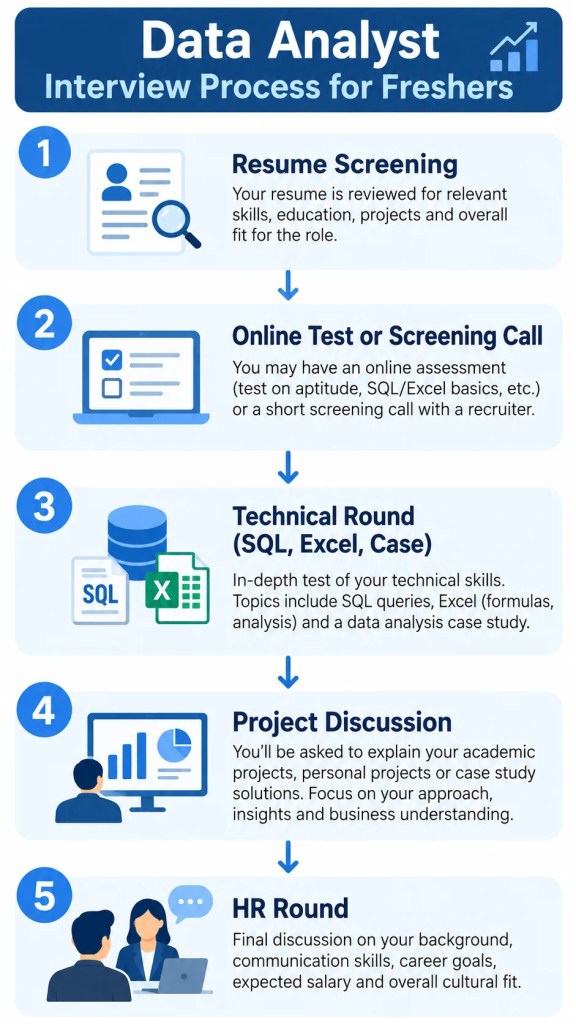
Typical Rounds
- Application and resume screening. Your resume, skills and projects are checked against the role.
- Online assessment or screening call. Often a short test on SQL, Excel, aptitude or basic logic, or a phone call to confirm your background and availability.
- Technical round. SQL queries, Excel tasks, a BI tool, basic statistics, and sometimes a small case study.
- Project discussion. You explain a project from your portfolio, usually the data, the method and the result.
- HR or managerial round. Behavioral questions, communication, expectations and fit with the team.
Some companies skip steps, merge them or add a take home task. If a recruiter shares the format, prepare for that format first.
What Interviewers Are Really Checking
For a fresher, the interviewer does not expect years of experience. They are usually checking four things:
- Basics: can you write a simple query, use a pivot table and explain a result?
- Thinking: when a number looks wrong, do you ask sensible questions before answering?
- Communication: can you explain your work to someone who is not technical?
- Honesty and learning: do you know where your knowledge ends, and can you learn quickly?
Basic Data Analyst Interview Questions for Freshers
These are the opening questions in most interviews. Keep each answer short and clear.
1. What does a data analyst do?
A data analyst collects, cleans and studies data to find patterns, then presents the findings through reports and dashboards so the business can make better decisions. Day to day this often means working with SQL, Excel and a BI tool.
2. What is the difference between data analytics and data science?
Data analytics mainly focuses on understanding what happened and why, using existing data, reports and dashboards. Data science goes further into building predictive models and algorithms, and usually needs deeper programming and statistics.
3. What is data cleaning?
Data cleaning is fixing or removing problems in raw data, such as duplicates, missing values, wrong formats and spelling inconsistencies, so that the analysis is reliable. Analysts often spend a large share of their time on this step.
4. What is the difference between data cleaning and data wrangling?
Data cleaning fixes errors in the data, such as duplicates and missing values. Data wrangling is the wider process of getting data ready for analysis, which includes cleaning but also reshaping, merging and transforming it into a usable format. In practice the two terms overlap, so be ready to explain how you use them.
5. What is the difference between structured and unstructured data?
Structured data is organized in rows and columns, like a table in a database or an Excel sheet. Unstructured data has no fixed format, such as emails, images, audio or free text.
6. What is a KPI?
A KPI (key performance indicator) is a measurable value that shows how well a business is meeting an important goal, for example monthly sales, customer churn rate or average delivery time. A good answer also mentions that a KPI should be tied to a clear goal.
7. What is a dashboard?
A dashboard is a single screen that shows the key numbers and charts of a business area, so people can understand performance quickly. Good dashboards are simple, focused on a few KPIs and built for a specific audience.
8. Describe your data analysis process.
A simple answer works well: understand the business question, collect the data, clean it, explore and analyze it, visualize the results, and share recommendations. Mention that you check the result against common sense before presenting it.
Read More: Excel vs Power BI vs Tableau: Which Should You Learn First?
SQL Interview Questions for Data Analyst Freshers
Is SQL asked in a data analyst interview? Yes. SQL is one of the most commonly tested skills for data analyst roles, so most freshers should expect at least a few SQL questions or a short query test. These SQL interview questions for data analyst freshers use one small sample table so the answers are easy to follow.
Sample table: orders
| order_id | customer_id | city | amount | order_date |
|---|---|---|---|---|
| 1 | 101 | Mysuru | 500 | 2026-01-05 |
| 2 | 102 | Bengaluru | 800 | 2026-01-07 |
| 3 | 101 | Mysuru | 300 | 2026-01-15 |
| 4 | 103 | Bengaluru | 1200 | 2026-02-02 |
9. What is SQL?
SQL (Structured Query Language) is the standard language used to store, retrieve and manage data in relational databases. Analysts use it mainly to pull and summarize the data they need.
10. What are the types of JOINs in SQL?
The common types are INNER JOIN (only matching rows from both tables), LEFT JOIN (all rows from the left table plus matches from the right), RIGHT JOIN (the reverse) and FULL JOIN (all rows from both). A JOIN combines rows from two tables using a related column.
11. What is the difference between INNER JOIN and LEFT JOIN?
INNER JOIN returns only the rows that have a match in both tables. LEFT JOIN returns every row from the left table and fills the right side with NULL when there is no match, which is useful for finding customers with no orders.
12. What is the difference between WHERE and HAVING?
WHERE filters individual rows before grouping, while HAVING filters groups after aggregation. For example, you use WHERE to keep only 2026 orders and HAVING to keep only cities whose total sales are above a limit.
13. What does GROUP BY do?
GROUP BY groups rows that share the same value in one or more columns so you can apply aggregate functions such as SUM, COUNT or AVG to each group.
SELECT city, SUM(amount) AS total_sales
FROM orders
GROUP BY city
HAVING SUM(amount) > 1000;
On the sample table this returns Bengaluru (2000), because Mysuru totals 800 and is filtered out by HAVING.
14. How do you remove duplicate records in SQL?
Use SELECT DISTINCT to return unique rows. To find duplicates, group by the columns that should be unique and use HAVING COUNT(*) > 1. Deleting duplicates usually needs a unique identifier, so check the table structure first.
15. What is a subquery or a CTE?
A subquery is a query written inside another query. A CTE (common table expression) is a named temporary result defined with the WITH keyword, which makes long queries easier to read and reuse.
WITH city_sales AS (
SELECT city, SUM(amount) AS total_sales
FROM orders
GROUP BY city
)
SELECT * FROM city_sales WHERE total_sales > 1000;
16. What is a window function?
A window function performs a calculation across a set of related rows without collapsing them into one row, unlike GROUP BY. Common examples are ROW_NUMBER, RANK and running totals using SUM() OVER (…). At fresher level, a simple example of ranking orders by amount within each city is enough.
Read More: Data Analyst vs Data Scientist: Career Path After a Data Analytics Course
Excel Interview Questions for Data Analyst
Excel is still widely used in Indian companies for reporting, including MIS reporting, so these Excel interview questions for data analyst roles come up often.
17. What is the difference between VLOOKUP and XLOOKUP?
VLOOKUP searches the first column of a range and can only return a value from a column to its right. XLOOKUP uses separate lookup and return ranges, so the return column can be on either side, and it can replace HLOOKUP too. XLOOKUP is not available in Excel 2016 or Excel 2019, so older versions still need VLOOKUP or INDEX and MATCH.
18. What is a pivot table?
A pivot table summarizes a large dataset by letting you drag fields into rows, columns, values and filters, so you can quickly see totals, counts and averages without writing formulas.
19. How do you remove duplicates in Excel?
Select the data, go to the Data tab and use Remove Duplicates, choosing the columns that define a duplicate. Always keep a copy of the original data first, since the action changes the sheet.
20. How do you handle missing values in Excel?
First find them using filters or functions such as COUNTBLANK. Then decide based on the situation: remove the rows, fill with a sensible value such as an average or a default, or flag them for follow up. Explain the reason for your choice.
21. What is conditional formatting?
Conditional formatting changes the look of cells, such as color, icons or data bars, based on rules. It helps highlight things like sales below target or duplicate entries.
22. What is the difference between COUNTIF and SUMIF?
COUNTIF counts the cells that meet a condition, while SUMIF adds up the values in cells that meet a condition. For example, COUNTIF counts orders from one city and SUMIF totals the sales amount for that city.
Power BI Interview Questions for Freshers
These Power BI interview questions for freshers cover the basics most entry level interviews test.
23. What is Power BI?
Power BI is Microsoft’s business intelligence tool for connecting to data, cleaning and modelling it, and building interactive reports and dashboards that can be shared with others.
24. What is Power Query?
Power Query is the data preparation tool inside Power BI (and Excel) used to connect to data sources and clean and transform data, for example removing columns, changing data types and merging tables, before it is loaded into the model.
25. What is DAX?
DAX (Data Analysis Expressions) is the formula language used in Power BI to create measures, calculated columns and calculated tables. A simple example is a measure such as Total Sales = SUM(Sales[Amount]).
26. What is the difference between a measure and a calculated column?
A measure is calculated at query time when a visual is rendered, so its result changes with filters and slicers, and only the formula is stored. A calculated column is calculated row by row and stored in the model, so it adds to the model size. Use a measure for totals and KPIs, and a calculated column when you need a row level value to filter or group by.
27. How would you build a dashboard for a manager?
Start by asking what decisions the manager needs to make, then choose a few KPIs, pick simple visuals such as cards, bar charts and line charts, add slicers for key filters, and keep the layout clean. Test it with the manager and refine.
A short note on Tableau: many employers use Tableau as an alternative to Power BI, and the interview questions are similar in spirit: connecting data, building charts and dashboards, and explaining insights. For a full comparison of the tools, read our guide on [Excel vs Power BI vs Tableau](INTERNAL LINK: Excel vs Power BI vs Tableau page).
Python Interview Questions for Data Analyst
Not every analyst role needs Python, but many job descriptions list it. These Python interview questions for data analyst freshers stay at the basics.
28. Why is Python used for data analysis?
Python is easy to read and has strong libraries for data work, such as Pandas for tables, NumPy for numerical operations and Matplotlib for charts. It can handle larger datasets and repeat tasks that are slow in Excel.
29. What is Pandas?
Pandas is a Python library for working with tabular data. It provides the DataFrame, which lets you load, clean, filter, group and summarize data in a few lines of code.
30. What is a DataFrame?
A DataFrame is a two dimensional table in Pandas with labelled rows and columns, similar to an Excel sheet or a SQL table.
31. What is the difference between a list and a dictionary in Python?
A list is an ordered collection of items accessed by position, such as [10, 20, 30]. A dictionary stores key and value pairs accessed by key, such as {“city”: “Mysuru”}.
32. How do you handle missing values in Pandas?
Check them with df.isna().sum(), then either remove rows with df.dropna() or fill them with df.fillna(value). Choose based on how much data is missing and why.
Statistics and Analytical Thinking Questions
33. What is the difference between mean and median?
The mean is the average of all values, while the median is the middle value when the data is sorted. The median is less affected by extreme values, so it is often better for skewed data such as salaries or house prices.
34. What is an outlier and how do you handle it?
An outlier is a value that is very different from the rest of the data. First check whether it is a data error or a genuine case, then decide to correct it, remove it, or keep it and report it separately. Never remove outliers without a reason.
35. What is the difference between correlation and causation?
Correlation means two things move together, while causation means one directly causes the other. Ice cream sales and heat can be correlated, but one does not cause the other, and extra evidence such as an experiment or A/B testing is needed to claim causation.
36. What is standard deviation?
Standard deviation measures how spread out values are around the mean. A small value means the data points are close to the average, and a large value means they are more spread out.
37. What is a p-value in plain language?
A p-value shows how likely it is to see a result at least as extreme as yours if there were actually no real effect. A small p-value (commonly below 0.05) suggests the result is unlikely to be just chance, but it does not prove the effect is large or important.
Scenario and Case Study Questions
Scenario questions test how you think, not whether you know one right answer. Use this simple framework for most of them:
- Clarify the question and the goal.
- Check the data for quality issues and definitions.
- Segment the numbers by time, product, region or customer type.
- Find the likely cause using the segments.
- Recommend the next action and say what you would monitor.
38. Sales dropped 10 percent last month. How would you investigate?
Clarify how sales are measured and compare with the same month last year to rule out seasonality. Check the data for missing or delayed entries, then split sales by region, product, channel and customer type to see where the drop is concentrated. Share the likely cause with a recommendation and next steps.
39. A report shows duplicate customers. What do you do?
Confirm the duplicates by checking the key fields such as customer ID, name, phone and email. Find out why they happen (for example repeated entries or different spellings), clean the data using a clear rule, document it, and tell the data owner so the cause is fixed at the source.
40. How would you explain a dashboard to a non technical manager?
Start with the business question and the one or two numbers that matter most, use simple words instead of tool terms, point to what changed and why it matters, and finish with a clear recommendation.
Behavioral and HR Questions for Data Analyst Freshers
Behavioral questions test communication and attitude. In the interview, a short and honest answer works better than a rehearsed speech.
These behavioral interview questions for data analyst candidates are usually asked in the HR or managerial round, though some interviewers add one or two in the technical round as well.
Tell Me About Yourself (Sample Answer for a Fresher)
Searches such as “tell me about yourself data analyst fresher” usually want a template, so here is one. It is a template, not a real person’s story. Replace the blanks with your own details and keep it under one minute.
Use three parts: your background, your skills and projects, and why this role.
“I completed my [degree] in [year] from [college]. During and after my studies I learned [SQL, Excel, Power BI, Python], and I built [number] projects, including one on [project topic] where I [what you did] and found [result]. I enjoy working with data to answer practical questions, and I am looking for a data analyst role where I can [what you want to do] and keep learning from a team.”
How do I answer “tell me about yourself” as a fresher data analyst? Keep it short, start with your background, move quickly to your skills and one project, and end with why you want this role. Do not repeat your whole resume.
Other Behavioral Questions and How to Answer Them
Use the STAR method for experience based questions: Situation, Task, Action, Result. It keeps the answer structured and short.
- Why do you want to become a data analyst? Give a real reason, such as enjoying problem solving with data, and link it to something you have done, like a project or course.
- Tell me about a project you have done. Use four sentences: the problem, the data, what you did, and the result. See the projects section below.
- What was the biggest challenge in your project? Pick a real challenge, such as messy data, and explain what you did to solve it and what you learned.
- How do you handle a tight deadline? Explain how you prioritize, communicate early if something is at risk, and focus on the most important output first.
- Where do you see yourself in three years? Show that you want to grow in analytics, build deeper skills and take on more responsibility, without sounding like you plan to leave quickly.
Questions to Ask the Interviewer
Asking questions shows interest and helps you judge the job. Two or three are enough:
- What kind of data and tools will I work with in the first few months?
- How is success measured for this role in the first six months?
- What does onboarding and training for new analysts look like?
- What kind of business problems does the team work on most?
How to Prepare for a Data Analyst Interview?
Knowing how to prepare for a data analyst interview matters as much as knowing the answers. The plan below is built for freshers who have a basic knowledge of the tools.
A 7 Day Preparation Plan
How to prepare for a data analyst interview in one week? Spend each day on one topic, practise out loud, and finish with a mock interview. The table below shows one way to split the week.
| Day | Focus | Output for the day |
|---|---|---|
| 1 | SQL basics: SELECT, WHERE, ORDER BY, aggregates | 10 simple queries written without help |
| 2 | SQL joins, GROUP BY, HAVING, subqueries | 5 join questions solved and explained |
| 3 | Excel: pivot tables, lookups, COUNTIF and SUMIF | One small report built from raw data |
| 4 | BI tool: build and explain a dashboard | One dashboard walkthrough said aloud |
| 5 | Python basics and statistics: Pandas, mean, median, outliers | 5 Pandas tasks and 5 statistics answers |
| 6 | Your project story and “tell me about yourself” | A 4 sentence project summary and a 1 minute introduction |
| 7 | Mock interview and review | One full practice round, with notes on weak points |
Projects to Mention (and How to Talk About Them)
What projects should a fresher data analyst mention in an interview? Mention one or two projects you actually completed, ideally using real or realistic data, for example a sales dashboard, a customer or churn analysis, or a data cleaning and reporting project. A portfolio project you can explain in detail is worth more than a long list you cannot discuss.
Describe each project in four sentences:
- Problem: what question you tried to answer.
- Data: where the data came from and what needed cleaning.
- Method: which tools and steps you used (for example SQL for extraction, Power BI for the dashboard).
- Result: what you found and what someone could do with it.
What We See in Mock Interviews
[PENDING: This block needs 4 to 6 real observations from Skill Up Academy trainers who run mock interviews as part of placement support. Please send the trainer name and the observations. Do not publish this heading until real input is added. No observations have been invented here.]
Can a Non Technical Graduate Clear a Data Analyst Interview?
Yes. Many analyst roles accept graduates from commerce, arts, science and engineering, as long as they can show practical skills in SQL, Excel and a BI tool, and can explain a project clearly. Interviewers usually care more about whether you can demonstrate the skills than which degree you hold. For a step by step learning path, see [How to Become a Data Analyst After Graduation](INTERNAL LINK: How to Become a Data Analyst After Graduation page).
Common Mistakes Freshers Make in Data Analyst Interviews
What are common mistakes freshers make in data analyst interviews? These are the ones to avoid, with a quick fix for each:
- Memorizing answers word for word. Fix: learn the idea and say it in your own words.
- Not knowing your own project well. Fix: be ready to explain every step, chart and number on your resume.
- Skipping SQL practice. Fix: write queries by hand daily, because many technical rounds include SQL.
- Giving technical answers with no business meaning. Fix: end answers with what the result means for the business.
- Overstating skills. Fix: say clearly what you know well and what you are still learning.
- Having no portfolio. Fix: build and publish at least one or two projects.
- Asking no questions at the end. Fix: prepare two or three from the list above.
- Not checking the numbers. Fix: sanity check totals and filters before you share a result.
Frequently Asked Questions
What questions are asked in a data analyst interview for freshers?
Freshers are commonly asked about SQL (joins, GROUP BY, WHERE vs HAVING), Excel (pivot tables, lookups), a BI tool such as Power BI, basic statistics, one or two projects and behavioral questions such as “tell me about yourself”.
Is SQL asked in a data analyst interview?
Yes. SQL is one of the most commonly tested skills for data analyst roles, so most freshers should expect SQL questions or a short query test.
How do I answer “tell me about yourself” as a fresher data analyst?
Keep it under one minute: your background, your key skills and one project, and why you want a data analyst role. Do not read out your resume.
How do I prepare for a data analyst interview in one week?
Spend one day each on SQL basics, SQL joins and grouping, Excel, a BI dashboard, Python and statistics, and your project story, then finish with a mock interview on day seven.
Can a non technical graduate clear a data analyst interview?
Yes, if they can show practical skills in SQL, Excel and a BI tool and explain a project clearly. Many employers look at demonstrated skills more than the degree.
What projects should a fresher mention in a data analyst interview?
One or two completed projects you can explain in detail, such as a sales dashboard or a data cleaning and analysis project, described as problem, data, method and result.
